Tag Archives: confocal

Corona Fog

In the past month or so we’ve increased our testing volume after limiting patient visits during a government mandated stay-at-home order during the COVID 19 pandemic. As we’ve ramped back up, we’ve changed our procedures to limit the risk of transmitting the virus. We’ve instituted stringent cleaning protocols, and installed breath shields on some instruments. All clinical personnel now wear PPE (masks, goggles, gloves) and all patients are required to wear masks while in the clinic. We’ve adapted to this “new normal” pretty quickly and our testing volume is almost back to pre-pandemic levels.

Another part of our new normal is a novel clinical finding that seems to be related to the COVID 19 pandemic. Prior to the pandemic, I hadn’t observed this finding. As our numbers increased, I started noticing artifacts that I couldn’t immediately identify in IR fundus images using the Spectralis OCT. I’m wondering how many others in the field have noticed the same thing.

Prominent dark shadow in the infrared fundus image on the left made it challenging to get a good quality OCT image.

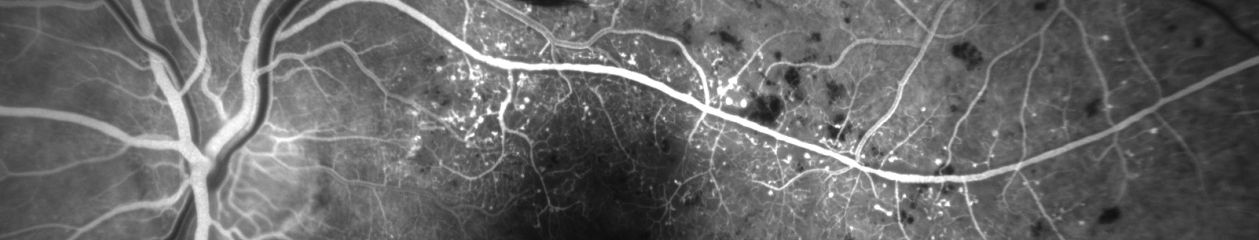
This patient came in two weeks ago. Here you see what appears to be vitreous hemorrhage or debris causing a dark shadow that obscures the view in the IR image. I really struggled to get good images. The OCT was adequate, but the accompanying IR fundus image was poor. Those of you that use the Spectralis know that any structure or pathology that is out of focus will typically appear dark because of the confocal pinhole that blocks scattered light from reaching the sensor. So it’s not uncommon to have a compromised view like that if there are media opacities such as dense cataracts, corneal opacities or vitreous pathology, so I didn’t think much of it at first.  

But then just two patients later I saw a similar artifact. This time it changed in appearance while I was imaging and got progressively worse. I had the patient sit back and re-positioned.

That seemed to improve the view, but within seconds it deteriorated again and got worse. It almost looked as if I were watching a vitreous hemorrhage occur live. I had the patient sit back yet again, waited several seconds, and resumed imaging. The artifact disappeared again!

Finally, I looked around the device at the patient’s face to see if there was anything I was missing. And then I noticed it, the patient had an ill-fitting mask and was fogging the lens with her breath! The position of the mask forced her breath directly onto the lens surface of the Spectralis. Because of the confocal nature of the Spectralis, the pinhole aperture causes the artifact to appear dark rather than just a simple fogging seen with a slit lamp, fundus camera, or any other non-confocal device.

I asked a few of my astute imaging colleagues about this and a few had seen it but were initially stumped as well. Collectively we now believe we are seeing a new artifact related to patients wearing masks. One of my colleagues thought it was more prominent with the SPECTRALIS 102 degree wide angle lens. That may be because of the different working distance from the patient (closer).

Shadowing on a Spectralis fluorescein angiogram with 102 wide angle lens from breath fog.
Image courtesy Gary Miller, CRA, OCT-C, FOPS

Looking back I realized that I had struggled with many patients during the peak of the lockdown. We were only seeing urgent/emergent patients at that time and were not routinely dilating patients in the interest of efficiency. So I assumed the darker fundus images were related to working with smaller pupils. It dramatically effects the confocal fundus image, but not always the OCT image because that component of the device is not confocal. The fogging seems to be more common with certain mask types or on days with high humidity.

Now when it occurs, I often just ask the patient to sit back for a few seconds until the fog clears clears and then resume imaging. Or we sometimes tape the top of the mask to the patient’s nose and cheeks to direct their breath down or to the side.

Changing the OCT working distance to the XL setting may reduce the fogging by changing the angle/distance from the patient’s mask.

Another trick is to change the OCT working distance (XL setting) as if you were trying to capture a longer eye. That effectively changes the angle between the patient’s mask and the front element.

My colleague Gary Miller and I have been unsuccessfully trying to come up with a catchy name for this finding. Here are a few of our attempts, but they’re all pretty lame.

Corona Fog
Pandemic haze
Mask mist
COVID condensation
Masquerade artifact

If you have a good one, put it in the comments section.

Here are the current recommendations from Heidelberg on cleaning optical surfaces in their devices. These recommendations seem pretty universal and would likely be similar to those from other manufacturers as well.

Update: A number of people have asked for a document to share whith coworkers. I created a quick pdf adaptation that can be found here.

Tim Bennett, CRA, OCT-C, FOPS

From Blogger to Scholar?

I always look forward to receiving my copy of the the Journal of Ophthalmic Photography in the mail. Even after reading digital proofs as an editor or contributing author it’s great to see the final product in print. There’s just something tangible and authentic about turning the pages of a high quality publication printed on good stock.

I was especially looking forward to the Spring 2016 issue of the JOP. It contains an article I contributed on The Confocal Tonal Shift. What’s unique about this article is that evolved from a blog post here on eye-pix into a scholarly article (of sorts).

The blog was based on an observational series of photographs that documents the tonal changes that occur when focusing the Heidelberg Spectralis, a confocal scanning laser ophthalmoscope (cSLO). I put the blog together to further my own understanding of just what I was seeing with the cSLO, and share my observations with fellow imagers. When asked to convert the blog into a piece for the JOP, I initially felt it was too informal, opinionated, and lacking strong references to be included in the professional literature.

web image2-640 crop

But the kernel of a good idea was definitely there. So I worked backwards and did a literature search after the fact. Then I reworked the article and was able to place my observations into the context of other clinical findings described in the ophthalmic literature. Probably not the ideal way to develop an idea into an article, but in this case it worked.

A mentor of mine has always encouraged me to get as much mileage as possible out of a project. The Confocal Tonal Shift is a good example of that. It’s gone from a blog post to a formal article in a well-respected professional journal. I’ve also adapted it into an expanded lecture topic (The Quirks of Confocal Imaging) that  I presented at a recent educational program. It received good feedback and will work it’s way into my lecture rotation this year.

The full journal article can be viewed here.

Bennett TJ. The confocal tonal shift.
Journal of Ophthalmic Photography, 38(1):17-22, Spring, 2016

First Look: Eidon Retinal Scanner

I recently had the chance to get a hands-on look at the Eidon confocal retinal scanner.  The Eidon is a hybrid device combining features of a non-mydriatic fundus camera with confocal scanning technology. It is manufactured in Italy by Centervue SpA. Centervue describes this instrument as the first true color confocal scanner on the market. It is different than a confocal scanning laser ophthalmoscope in that it uses a broad spectrum white light LED (440-650 nm) rather than monochromatic lasers.  A second light source provides near infrared (IR) imaging at 825-870 nm. The advantage to confocal imaging is that it suppresses out-of-focus light from reaching the image sensor. This minimizes the effect of cataracts or other media opacities, resulting in sharp, high contrast images. The confocal design also allows it to image through a smaller pupil than a typical non-mydriatic camera.

eidon1The footprint of the Eidon is fairly compact, but the instrument is taller than most fundus cameras. The device is operated via touch screen tablet and has both automatic and manual controls.  The Eidon has a fixed 60 field of view, but is capable of capturing several fields and creating montage images. It features a 14 megapixel sensor to capture color, red free, and infrared images. The red free photos are extracted from the color image rather than through a separate exposure with a blue-green light source.

The capture software is incredibly simple to use. It is about as automatic as a device can get. Using the touch screen tablet, you enter the patient demographics and program it for the desired fields of one or both eyes and push the start button. The device does the rest automatically, even telling the patient to open their eyes prior to each flash capture.

Eidon2

The internal fixation light will step through the various fields and capture each one automatically. Auto-alignment is accomplished by identifying the center of the patient’s pupil with IR.  It will then focus automatically with a range of -12D to +15D. Once focused in IR, the camera will slightly readjust focus just prior to color capture to account for the difference in wavelengths between color and IR. The autofocus works very well, but eye movement during capture can contribute a slight blur to the image.

Minimum pupil size is 2.5mm. It does capture good images at this pupil size in the posterior pole view but like any other non-myd device, it works a little better if patients are pharmacologically dilated. This is especially helpful when imaging peripheral fields or you plan to do a montage. I have found this to be true with all non-myd color fundus cameras. I would like to see separate exposure settings to reduce the gain and noise for eyes with widely (pharmacologically) dilated pupils.

composite 4-640
Left to right: cropped images from a non-mydriatic camera, Optos composite red/green, and Eidon. Photos of the same pseudophakic eye were taken on different dates.

The resulting images appear different than what we see with either a digital fundus camera or a cSLO. Centervue refers to the broad spectrum imaging as “True Color” to distinguish Eidon images from SLO composite laser color images from Spectralis or Optos.

todd darker 640

The Eidon attempts to address some of the limitations of digital fundus cameras that are poorly calibrated for color balance, gamma, and exposure. In doing so, it seems to sacrifice some color fidelity and a true appearance of the optic nerve. The red channel is desaturated to avoid loss of detail from oversaturation, but many Eidon images appear slightly green and might benefit from a little more red or magenta bias to the color balance.

noise1

Although the pixel count of the Eidon sensor is quite high, the color images seem a little over-processed and a bit noisy when zoomed in, probably from  the increased contrast as well as the high gain settings that allow it to capture through very small pupils.

cropped nerveOne of the features touted by the manufacturer is that it prevents “optic disc bleaching” seen with some fundus cameras. It does hold detail in optic disc photos, but the flip side to this is that the rim of the nerve can appear abnormally dark or gray, making it difficult to document pallor. Disc bleaching shouldn’t be  a problem in fundus cameras that are calibrated for proper contrast and exposure.

disc compare2-640
Left: Traditional color fundus image with a well balanced 11 MP color sensor. Right: Same eye taken with Eidon.

I also played with the digital joystick and manual mode changing the level of focus to see if the instrument exhibited the confocal tonal shift seen with the Spectralis. In playing with manual mode to alter focus or exposure, it became clear that the instrument works best in full-auto mode.

ICSC3-640
We did not see the confocal tonal shift in either color or IR images when looking at elevated lesions or manually changing the focus. Left: Spectralis IR (820 nm) image of serous detachment exhibiting tonal shift from elevation. Right: Eidon IR (825-870 nm) does not demonstrate the same effect even though it is also a confocal device.

The Eidon review software is functional, but could be a little more streamlined. It would be nice to scroll though successive images, rather than having to go back and forth to the proof sheet to open each frame individually. The montage software works quite well.

montage darker 640

The bottom line is that the Eidon is a very interesting hybrid device that combines features of confocal scanning with full color capture in a package that is incredibly simple to use. It would be a great screening tool or replacement for a fundus camera in primary eye care settings and would require minimal staff expertise or training.

Thanks to Todd Hostetter, CRA, COMT for bringing the device to the clinic for a demo, and to Jim Strong, CRA, OCT-C for help taking some of the images.

Disclaimer: I have no financial or proprietary interest in this device.

The Confocal Tonal Shift

The Heidelberg Spectralis confocal scanning laser ophthalmoscope (cSLO) is a commonly used diagnostic imaging device that uses monochromatic laser illumination to image the eye. It can be used for several retinal imaging modalities including infrared reflectance (IR), fluorescein angiography, ICG angiography and fundus autofluorescence (FAF). The confocal capability of the cSLO allows it to capture high-contrast, finely detailed images.

But what does confocal actually mean and how does it work? The word confocal simply means “having the same focus”. In this case it refers to the confocal pinhole or aperture that is optically located at the same plane of focus as the subject. The cSLO utilizes a focused laser to scan the subject point-by-point and then captures the reflected light after it passes through a confocal pinhole. The pinhole suppresses out-of-focus light from reaching the image detector resulting in very sharp images. The confocal pinhole is especially effective at eliminating unwanted scatter from cataracts or corneal opacities since these structures fall far outside the plane of focus.

cataract
Left: Patient with a cataract obscuring the view of the retina and optic nerve through a fundus camera. Right: The confocal pinhole of the cSLO suppresses the scatter from the cataract improving the view of the fundus.

When imaging a patient, you can see the confocal effect as you adjust the focus to the plane of the retina where it is most light efficient. The image on screen will get brightest just as you come into sharpest focus. A secondary effect of the confocal aperture is how it effects the appearance of elevated or out of focus retinal structures.

papilledema1
The plane of focus effects reflectivity and appearance of retinal tissues based on depth due to the confocal aperture. All three images are at the same wavelength. Focus is on the elevated optic disc on the left image. Tonality changes as focus is shifted to the retinal surface.

Adjusting the focus knob of the Spectralis can have a dramatic effect on the tonal appearance of elevated structures such as papilledema or vitreous floaters as seen here in this video.

Note the optic nerve get progressively darker as focus is adjusted from the peak of the nerve to the surface of the surrounding retina, which starts to appear brighter. The opposite occurs in the second example. Vitreous floaters from asteroid hyalosis appear as dark shadows when focus is set on the optic nerve. As focus is shifted up into the vitreous, the floaters begin to brighten and the retina fades to  dark. The brightness/exposure has not been adjusted during this tonal shift.  The only change is the focus.

So what does this mean for us as diagnostic imagers? Because of the inherently shallow depth of focus of the cSLO, some ocular structures may appear dark simply because they are slightly out of focus. Elevated serous detachments or papilledema are examples of this phenomenon that I call the confocal tonal shift.

serous detachment 2
A case of central serous chorioretinopathy with a classic serous detachment that can be seen ophthalmoscopically. The cSLO image is dramatic in it’s appearance due to the confocal shift. The dark area is elevated and filled with clear fluid (not blood).

In some cases the confocal tonal shift can enhance the diagnostic information by clearly outlining the borders of an elevated area or lesion. The effect is most notable with the IR laser and in red free mode.

wavelength small
The confocal tonal shift in three different modalities. From left to right: IR, monochromatic blue, fundus autofluosescence. The effect seems to be most pronounced in IR mode.

The confocal tonal shift also has the potential to create tonal “artifacts” which can confound the appearance of findings like blood or hemorrhage that inherently appear dark.  Vitreous opacities will appear dark because they are usually out of focus and blocked by the confocal pinhole. But are they from blood or vitreous debris? It’s impossible to tell with the cSLO since they appear the same even though one is translucent and one is more opaque when viewed ophthalmoscopically or with a fundus camera.

vitreous floaters-640
Vitreous debris can appear very dark in cSLO images even though it is almost completely transparent. Without a frame of reference, it is impossible to know if these dark areas represent floaters or vitreous hemorrhage.

Similarly, it is difficult to distinguish between blood and elevation within retinal tissues in conditions such as macular degeneration, retinal vein occlusions and diabetic macular edema.

NPDR2-640
Patient with bilateral diabetic macular edema (DME). There are some associated dot and blot hemorrhages present, but the dark patches are a result of elevation from the DME. Each of these dark areas correspond to elevation on OCT.

brvo-640
Branch retinal vein occlusion (BRVO). The dramatic dark lesion is a result of both hemorrhage and elevation.

It is important to note that elevated lesions can appear dark regardless of the pathologic location in the fundus.  cSLO imaging alone can’t always differentiate the anatomic location. OCT imaging or angiography may be necessary to further investigate the location of the pathology.

comparison1-640
Left: choroidal tumor. Right: serous retinal detachment. Two very different disease processes but they appear quite similar because of the confoccal shift.

In some cases, the the confocal pinhole may suppress light that is reflected from the actual plane of focus, but is slightly blurred because of scattering from a lesion in tissue that is normally clear.

PAMM4-640
IR imaging with the cSLO can help identify paracentral acute middle maculopathy (PAMM). Although these lesions aren’t elevated, light scatter from the slight thickening in the middle retinal layers are suppressed by the confocal pinhole making the lesionappear dark. The findings are far more subtle in the color fundus photographs.

Although originally designed to image the retina, the cSLO can also be used to image the front of the eye. The confocal tonal shift may also effect the appearance of some anterior segment findings.

iris atrophy3
Patient with iris atrophy. The cSLO is focused on the surface of the iris which make these dark brown irides appear light at the plane of focus. The dark areas represent absence or thinning of the anterior iris surface. The deeper, out-of-focus, layers appear dark.

In addition to the confocal shift, light scattering from some corneal lesion types may also be suppressed by the pinhole contributing to the dark appearance of the lesion.

corneal opacity2 small
Corneal opacities shown with diffuse illumination and sclerotic scatter at the slit lamp. The cSLO image on the right more clearly delineates the extent of the lesion. Focus is at the level of the iris with the cornea being out of focus. Where the cornea is clear, there is no blocking effect from the confocal pinhole. But where there is scatter and reflectivity from the (out-of-focus) corneal lesion, this light is rejected by the confocal pinhole causing the dark appearance.

It is important to understand the confocal density shift when capturing or interpreting cSLO images and differentiate between structures that truly are dark from those that are simply out-of-focus. In some cases the tonal shift enhances areas of interest that may not be easily identified by other means. In others it may confound the documentation of blood  or hemorrhage. A second imaging modality such as color fundus photography, OCT or angiography is often needed to present a more complete diagnostic imaging study.

Here are a few more examples:

DME1-640
Diabetic macular edema (DME) appears dark on the IR image from the tonal shift and corresponds to the red (increased thickness) area on the OCT false-color thickness map.

examples
Left: cystoid macular edema (CME). Right: central serous chorioretinopathy.

examples1-640
Dark lesions on two separate patients diagnosed with one of the phakomatoses. Left: a patient with tuberous sclerosis and multiple hamartomas that appear dark from elevation. Right: a retinal hemangioma in von Hippel-Lindau disease. This blood filled lesion is dark from the blood itself rather than elevation

WagnerB not dark640
This case represents a rare exception to the tonal shift in an elevated lesion. Adjusting the focus up and down had little effect on the tonal density, except at the borders of the lesion. Note the very high reflectivity of the inner retina on OCT. Presumably the reflective surface of the elevated area was bright enough to attenuate the normal confocal shift.